See exactly what you would be looking at.
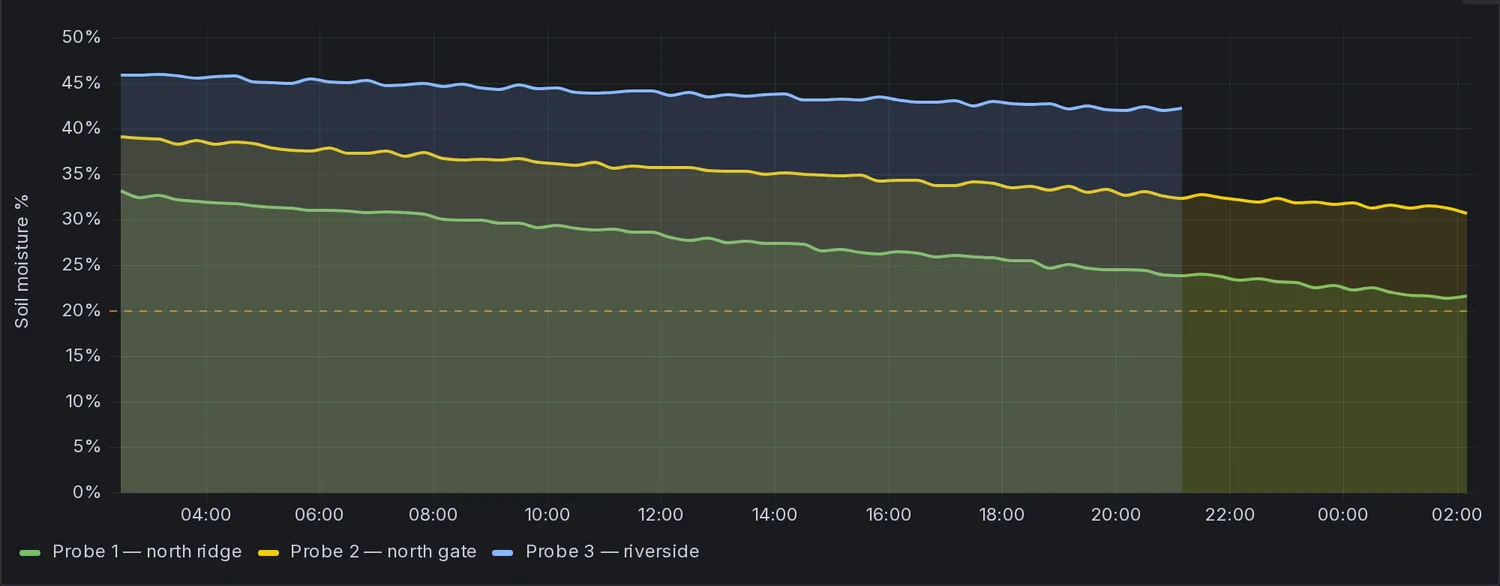
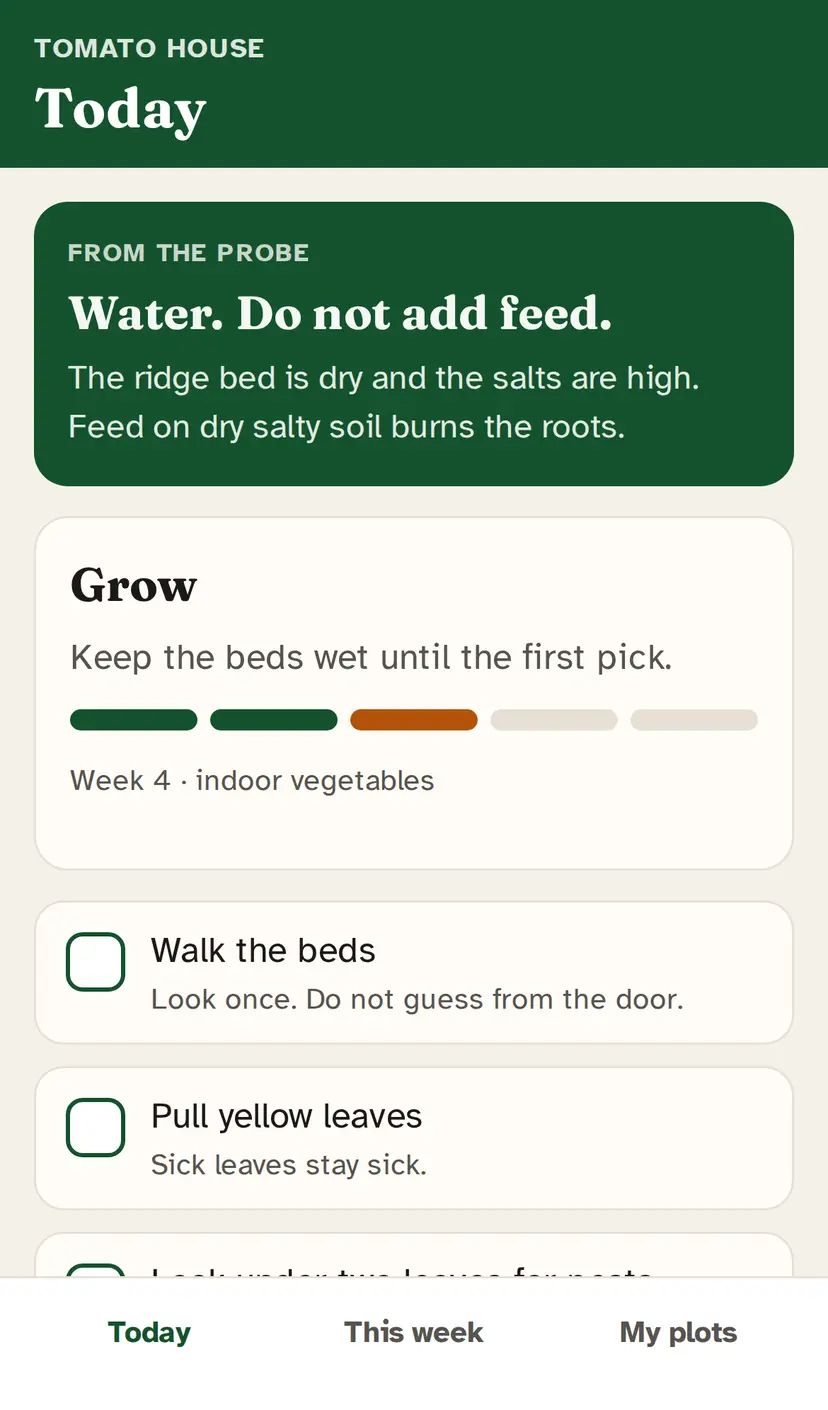
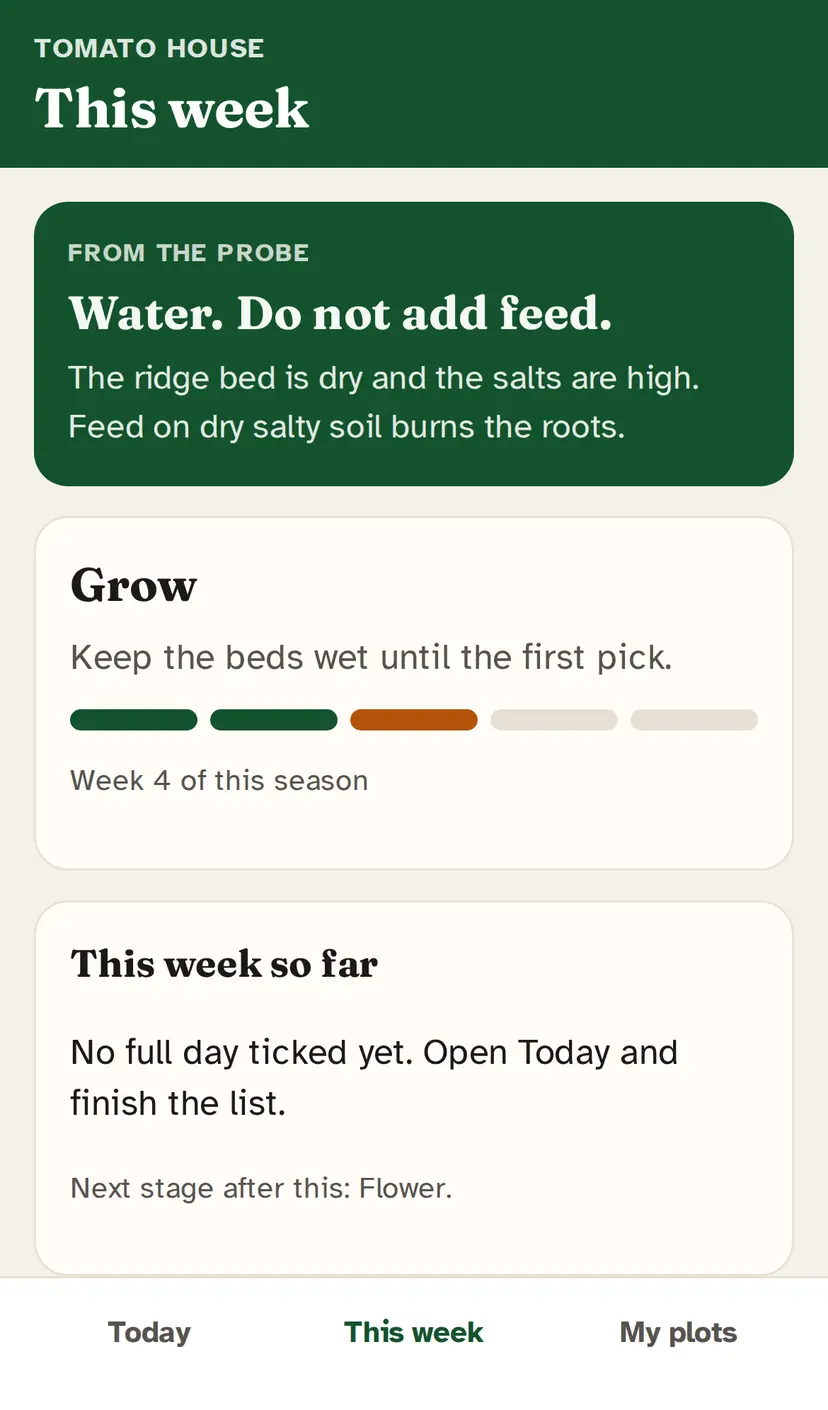
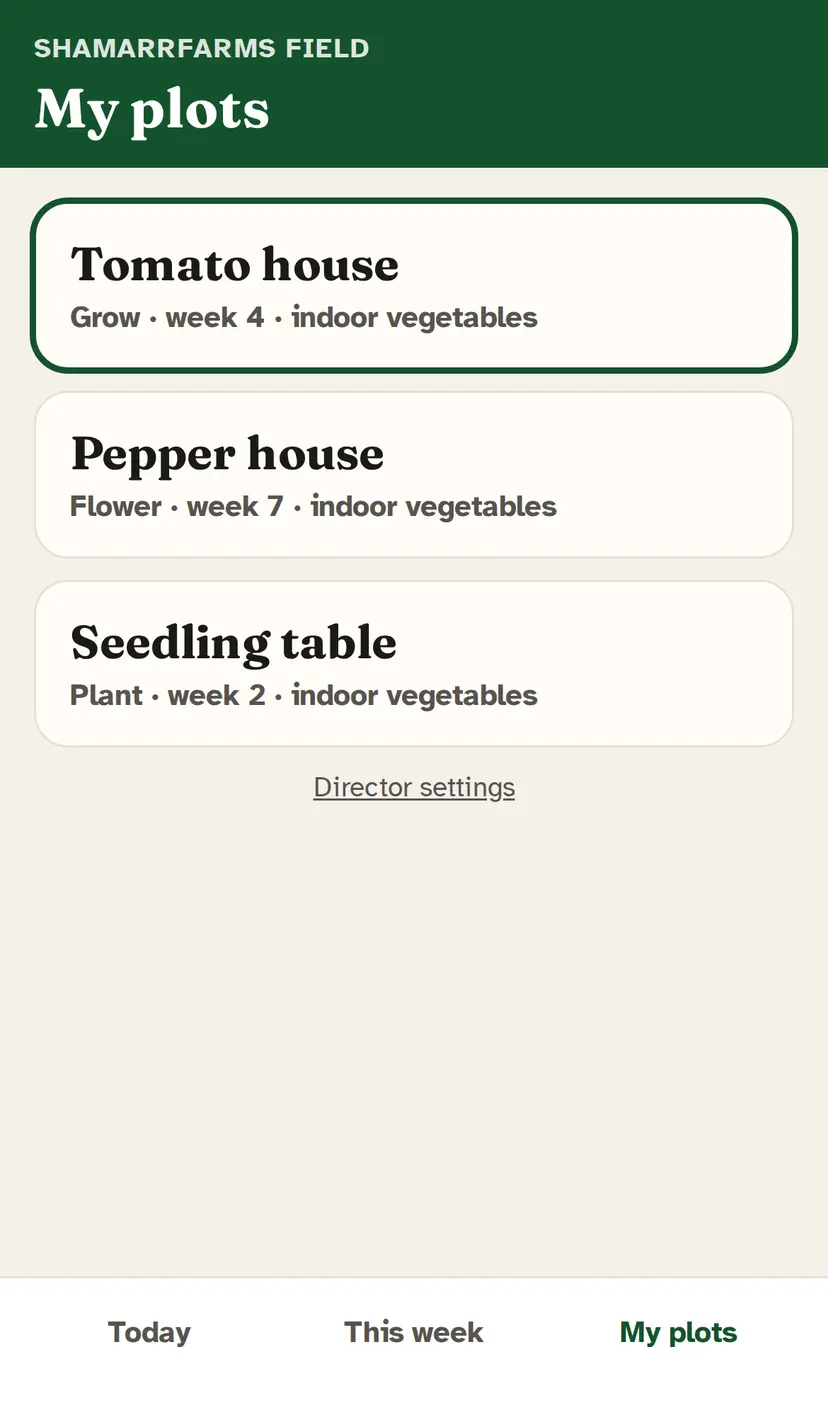
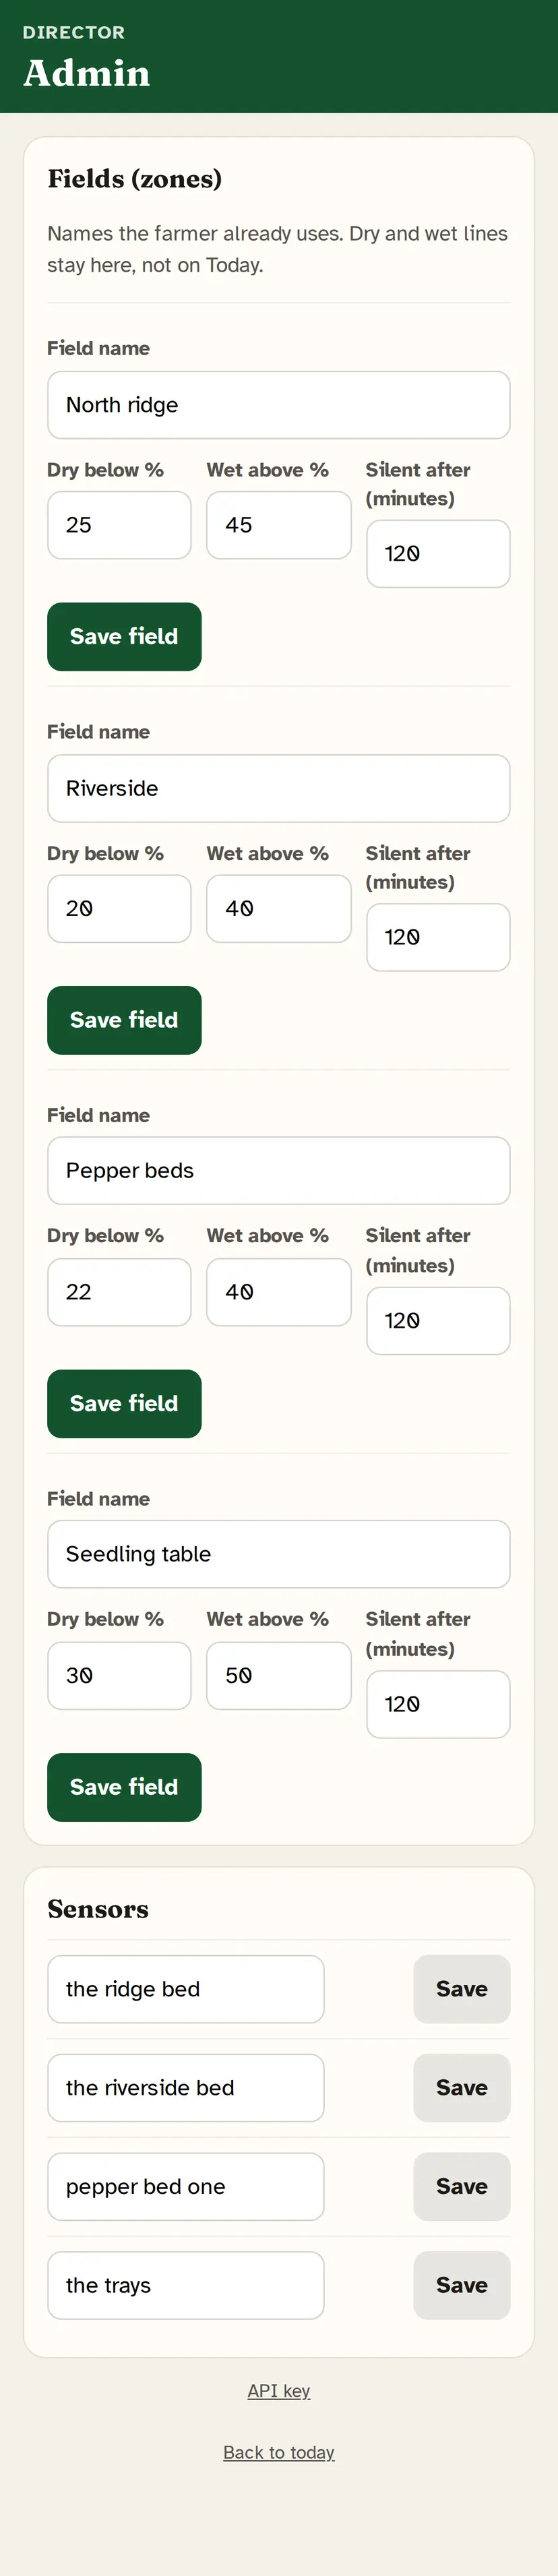
Screens from the software we ship. The farm hand opens Today and taps jobs. The box still records moisture, temperature and salts underneath. What each picture proves, and what it does not, is written underneath it.
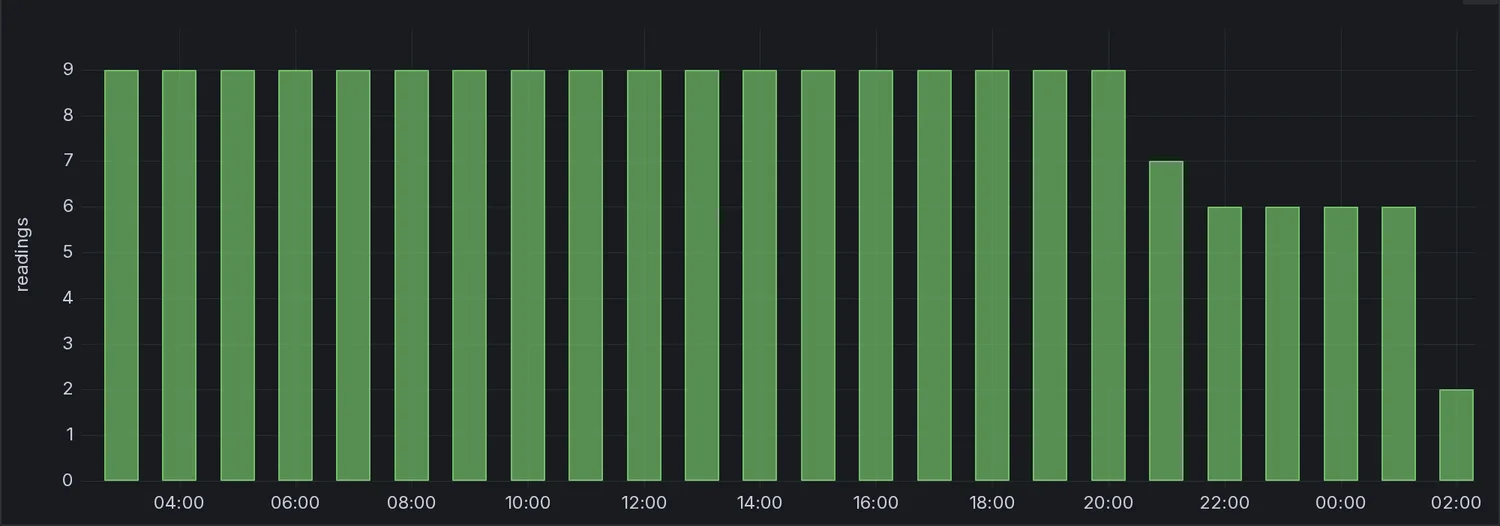
Every field and every probe in these pictures is labelled SIMULATED, in the data itself, so the label survives a screenshot. Inventing soil to show the software is fair. Letting you think the soil is real is not. The first real probes go in with the Phase 1 kit. Until then, book a walkthrough if you want someone to click through it with you.

What is proven, and what is not
Stated in the same terms we would accept from a supplier.
The data path, end to end
Sensor uplink through gateway, ingestion, storage, dashboard and phone view, running on the target hardware, with nine of nine minimum-spec conformance checks passed.
Survives bad connectivity
Ten of ten outage-replay tests passed: when the link drops, readings queue on site and replay in order once it returns. We also shove the whole backlog back in one burst, because a queue breaks on the way back in, not on the way out. Two hundred readings, none dropped.
A full season in the field
Every reading so far is a simulated uplink. No probe has been in Nigerian soil through a season yet, so probe accuracy under real heat and real ground is unmeasured. The Phase 1 kit is what settles it, and those results get published the same way as these.
Yield impact figures
We do not quote a yield percentage. Nobody can honestly attribute one before several instrumented seasons exist on your own fields.